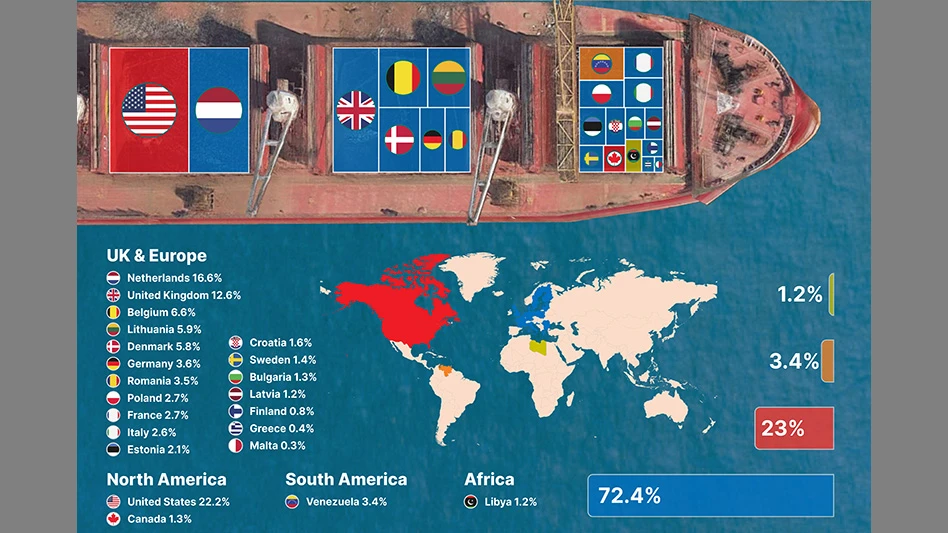
Image courtesy of Navigate Commodities
A detailed portrayal of the 2024 Turkish imported steel scrap market has been issued by Navigate Commodities, a Singapore-based dry bulk commodity supply chain intelligence firm focused on the upstream and downstream iron, steel, stainless and nickel industries.
The graphic representation consists of three charts showing which companies shipped steel for recycling to Turkish ports, from which nations those vessels departed and what type of bulk cargo vessel carried the material.
Atilla Widnell, managing director of Navigate, told delegates at a 2024 recycling convention his company monitors the movement and consumption of dry bulk commodities over land and sea using satellite-based technologies to track river barges, ocean-going vessels, inventory stockpile levels and, ultimately, melt shop activity around the world.
The firm’s promptly calculated 2024 overview of Turkish imports shows buyers for mills in that nation scoured the planet for recycled steel last year. Additionally, while consolidation of the scrap industry in some nations has gained momentum, the overview portrays a global scrap market that can still be considered competitive or even fragmented.
The United States was the single largest provider of ferrous scrap to Turkish mills in 2024, supplying 22.2 percent of the nation’s inbound material.
However, when considered together, continental Europe plus the United Kingdom combined to ship 72.4 percent of Turkey’s imported ferrous scrap, helping feed the nation’s numerous electric arc furnaces.
The United Kingdom’s contribution amounted to 12.6 percent of scrap purchased by Turkish mills last year. That was outweighed only by what was shipped from the Netherlands, at 16.6 percent. Dutch ports such as Rotterdam, however, aggregate and ship scrap from neighboring nations as well as domestic material.
After the U.S., Netherlands and U.K. placed first, second and third, the next busiest outbound ports were found in Belgium (6.6 percent), Lithuania (5.9 percent), Denmark (5.8 percent), Germany (3.6 percent) and Romania (3.5 percent).
A chart showing companies’ shipments features EMR Ltd. and Sims Ltd. as the only two firms responsible for a double-digit percentage of shipments—14.6 percent for EMR and 12.1 percent for Sims. In October 2024, Sims sold off its U.K. assets to Unimetals Ltd.
Numerous other firms chipped in with single-digit contributions, including U.S.-based Radius Recycling, Mazza Iron & Steel and Smith Industries and Canada-based American Iron & Metal.
Another piece of the chart labeled “Common User” also reached a double-digit figure (11.8 percent) in 2024. Widnell says those shipments occur when a recycler utilizes a generic multiuser berth, dock or terminal which is not assigned or dedicated to one particular purpose or user, and while the monitoring of a ferrous scrap-laden bulk carrier is highly accurate, defining the exact supplier (from space) becomes significantly more challenging.
“We’re extremely proud to curate these stunning visuals using data sourced solely from Navigate Commodities’ own proprietary satellite-based global dry bulk supply chain monitoring platform, which brings together a powerful combination of real-time data and storytelling to deliver never-seen-before analytics," Widnell tells Recycling Today.
“We’ve specifically chosen to broadcast this first-of-its-kind infographic for the ferrous scrap industry through our friends at Recycling Today so that the whole industry can benefit from these real-time analytics, expand our horizons, and the way in which we think about and consume data."
The entire infographic with all three charts can be viewed on and after Jan. 6 in a Navigate Commodities post on LinkedIn.
Latest from Recycling Today
- BMW Group, Encory launch 'direct recycling’ of batteries
- Loom Carbon, RTI International partner to scale textile recycling technology
- Goodwill Industries of West Michigan, American Glass Mosaics partner to divert glass from landfill
- CARI forms federal advocacy partnership
- Monthly packaging papers shipments down in November
- STEEL Act aims to enhance trade enforcement to prevent dumping of steel in the US
- San Francisco schools introduce compostable lunch trays
- Aduro graduates from Shell GameChanger program


