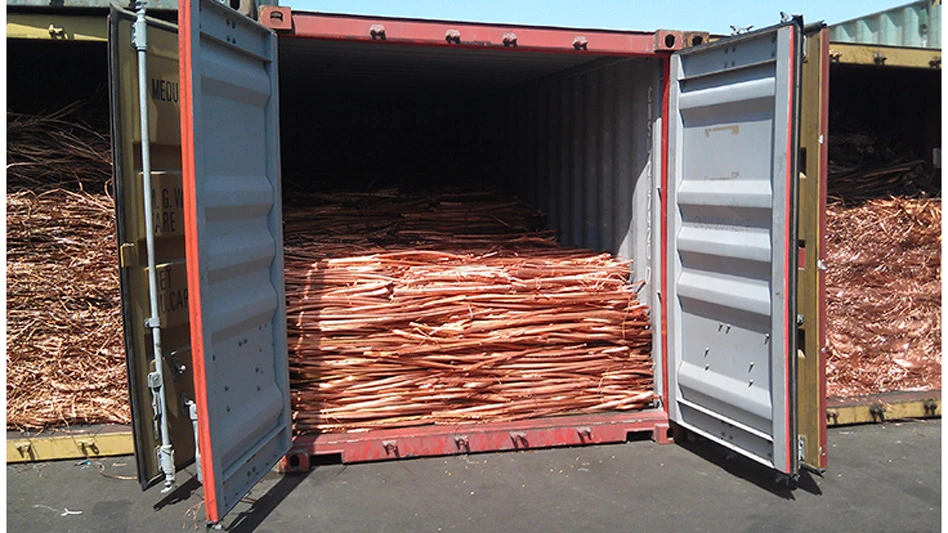
 For more than a decade, images of used electronics and their derivative components mounded outdoors in developing countries have propelled interest in the export of these items from the global North to the global South.
Of all of the computers, monitors, TVs and mobile phones collected for recycling in the United States in 2010, an estimated 9 percent were exported on a unit basis, or 3 percent on a weight basis. These are some of key findings of the hybrid sales obsolescence trade data method (HSOTDM) presented in a recently published report, the “Quantitative Characterization of Domestic and Transboundary Flows of Used Electronics Analysis of Generation, Collection and Export in the United States.” The Massachusetts Institute of Technology Materials Systems Lab (MIT MSL), Cambridge, Mass., and the National Center for Electronics Recycling (NCER), Parkersburg, W.Va., authored the report, which was funded by Solving the E-waste Problem Initiative (StEP), a United Nations initiative. The primary goal of the study was to develop and apply a robust methodology for estimating the exports of used electronics from the U.S. to the rest of the world, with a particular interest in developing country recipients.
Destination determined
While mobile phones dominate generation, collection and export on a unit basis, TVs and monitors dominate on a weight basis. As shown in the figure on page 82, Latin America and the Caribbean (LAC) is a common destination for the used products, followed by North America (NA). Asia represents the next largest destination, while Africa is the least common destination for used electronics.
Since the estimates are based on trade data and some products are likely improperly classified, the quantities should be considered lower-bound estimates. However, the proportions of exports going to different world regions are assumed to be an accurate reflection of the destinations.
Bulky electronics, especially TVs and monitors, were more likely to be exported overland or by sea to destinations such as Mexico, Venezuela, Paraguay and China. The major destinations for mobile phones were Asia (mostly Hong Kong) and LAC (particularly Paraguay, Guatemala, Panama, Peru and Colombia).
By contrast, Asia—which serves as key transit ports for international distribution in Asia and Africa, including Hong Kong, the United Arab Emirates (UAE) and Lebanon—were more likely to receive used computers, especially laptops, and are likely re-exporting many of those devices to surrounding countries.
It is interesting to note that Africa makes up such a small fraction of the total used electronics exported directly from the U.S. About 80 percent of exported used electronics, including TVs, monitors and mobile phones, have been exported to countries with upper-middle, low-middle and low-income economies as defined by the World Bank. However, the majority of the upper-middle class economies, such as Hong Kong and the UAE, are likely re-export hubs for further distribution to neighboring low income economies.
Domestic flows
For comparison points, we also developed and applied methods to estimate the quantity of electronics that were collected or landfilled in a given year. Approximately 258 million units of used electronics (computers, monitors, TVs and mobile phones) were generated in 2010, of which 171 million, or two-thirds, were collected.
To calculate how many electronics are generated (coming directly out of use or postuse storage destined for collection or disposal via landfill or incineration), we followed the sales obsolescence approach. The sales of new products are combined with estimates of the life spans of products to estimate which year a product will be generated. We used previous studies as well as detailed user surveys to find the probability that an item would be used for a certain number of years.
After that, we used a set of several representative user surveys spanning from 2005 to 2012 to estimate how many products are collected versus how many are sent for disposal.
Dearth of data
Global interest in the exportation of used electronics has increased in the last 10 years. Certification schemes for used electronics processors have emerged in the U.S., which vary in their allowance or prohibition of certain exports.
The U.S. federal government’s Interagency Task Force on Electronics Stewardship compiled a National Strategy for Electronics Stewardship in July 2011. One of the proposed efforts to “Reduce Harm from U.S. Exports of E-Waste and Improve Safe Handling of Used Electronics in Developing Countries” was to “improve information on trade flows and handling of used electronics and share data with federal and international agencies, within the limits of federal authorities.” This study is in alignment with that goal.
Despite growing interest and concern surrounding this topic, there is a dearth of data. Although a multitude of different data sources exist, coherent sets of information on used electronics and their movement are lacking because of inherent challenges in obtaining such information. These challenges include limited mechanisms for data collection, lack of consistent definitions for categorizing and labeling used electronics and components, lack of consistent definitions and lack of knowledge of downstream processing and uses (i.e., reuse versus recycling), minimal regulatory oversight and illicit actors operating in the system.
Recently, the U.S. International Trade Commission (USITC) reported results from a mandatory survey of many actors in the used electronics reverse supply chain. Based on 5,200 survey responses focusing on the year 2011, conclusions were made regarding the fate of many types of electronics and their component and material derivatives.
The study also briefly analyzed shipment level trade data from 2011, though used-new thresholds were not developed yet at that time.
Exploring export data
Currently, the trade codes used for electronics around the world do not distinguish between new and used electronics. After briefly exploring the available U.S. aggregate electronics trade data and discovering that such clear gaps did not exist, our team initially assessed that using the trade data would involve a low amount of effort but also yield low information quality. Therefore, the collected trade data approach was not recommended in our summary report.
We did, however, also review the uncertainty, representativeness, availability and cost of bill of lading (BOL) data, which detail every export shipment. We estimated that it would require a moderate amount of effort and yield moderate quality data. With detailed data, either the description of the product would reveal its “used” status or its low unit value could infer it.
The trouble with the available BOL data sets was that they were incomplete and, therefore, could not meet our goal of scaling to the national level. Complete shipment-level data sets are restricted for confidentiality and require an extensive review process to access.
Determined to see if we could find alternative trade data sets that would reveal similar findings as the BOL data, we engaged in discussions with officials responsible for the recording and dissemination of trade data and searched the Web for data sets for purchase. Fortunately, we found that a combination of the U.S. Census Bureau’s Foreign Trade Division’s USA Trade Online port-level data and district-level data obtained from http://sicex.com could yield detailed data suitable for distinguishing used electronics from overall exports.
Pros and cons
One comparative advantage of the trade data approach is that it tracks the destinations of shipped products. There are two types of exports: domestic exports, which originate in the export country, and re-exports, which are imported from a partner country and typically change hands before being exported once again. We assumed that U.S. used electronics are in the domestic exports category.
Still, the destination in the trade data may be an initial stopping point, and the products may then be re-exported to a final destination; re-exports and final destinations are not always reported in trade data. However, if it is a stopping point before re-export, the final destination is likely in the same region.
A disadvantage of using trade data is that any intentional or unintentional misclassifications of exported items cannot be estimated. Therefore, as previously mentioned, the results from these methods should be considered lower-bound estimates since there are likely whole units of used electronics that are exported using other trade codes either to avoid tariffs or import restrictions.
Used from new
With a histogram of domestic exports comparing their unit value to quantity, the exports with a lower value than the used-new threshold are deemed to be “used.”
We developed three methods to find the used-new thresholds applicable for exports to each world region. Throughout our study, we sought to capture the uncertainty in our estimates and used several methods to compare one against the others. The first two methods employed a mathematical algorithm to find the valley between the used and new exports in U.S. and Chinese (because of its position as an exporter of new electronics) export data. The third method looked to market data and past studies to find the price point separating new and used electronics. For example, laptop prices set by suppliers on the website Amazon.com in August 2012 revealed a used-new threshold of approximately $220.
Going forward
To enhance and expand the use of trade data to provide insights into U.S. exports of used electronics, we recommend that trade codes be adopted first in the U.S. and then worldwide that distinguish classes of used electronics. Countries such as Japan already have taken steps toward establishing distinct trade codes. In parallel, if researchers could have easier access to shipment level data, the quality of their estimates would be improved because the data available for analysis would be more detailed with access to such information.
Since there is and will continue to be uncertainty regarding the complex trade of used electronics, multiple approaches should be undertaken and compared. A nice complement to the trade data method would be more extensive, audited data sets provided by the used electronics processing industry itself. This way, reported output destinations from the electronics recycling and refurbishment industry could be contrasted with the available trade data to provide a more certain estimate range.
Tracking the data over time could reveal how various policies and practices influence trends in the global destinations for used electronics recovered in the U.S. as well as provide valuable insight to a wide variety of stakeholders.
Click here for additional Electronics recycling charts.
The summary of the study “Quantitative Characterization of Domestic and Transboundary Flows of Used Electronics Analysis of Generation, Collection and Export in the United States” was submitted on behalf of its authors, Jeremy Gregory, a Massachusetts Institute of Technology Materials Systems Lab (MIT MSL) research assistant, jgregory@mit.edu; T. Reed Miller, an MIT MSL research associate, trmiller@mit.edu; and Jason Linnell, executive director at the Parkersburg, W.Va.-based National Center for Electronics Recycling (NCER), jlinnell@electronicsrecycling.org.

Explore the April 2014 Issue
Check out more from this issue and find your next story to read.
Latest from Recycling Today
- USTR announces phased measures designed to address China’s shipbuilding dominance
- APR, RecyClass release partnership progress report
- Clearpoint Recycling, Enviroo sign PET supply contract
- Invista expanding ISCC Plus certification program
- Redwood partnership targets recycling of medium-format batteries
- Enfinite forms Hazardous & Specialty Waste Management Council
- Combined DRS, EPR legislation introduced in Rhode Island
- Eureka Recycling starts up newly upgraded MRF


